Modified : 31 Aug 2022

Introduction
Health checks are important in any production environment. It’s basically checking whether the server is up and running. As simple as that. But with various types of programs, we can implement various checks. For example, checking if a certain route is available and if database connections are working etc.
But you could ask, we already do all that with Node JS unit testing, why do we need health checks? The reasons are plenty
- What if the applcation crashed?
- What if the server crashed?
- What if the data center failed?
- What if (God forbid!) the site is under DDOS?
- Application is leaking memory?
- Heavy computations?
- Identify bottlenecks?
Implement health checks!
You would want to monitor the uptime of your application and be notified immediately if it fails.
Simple Health Check (Express Server)
Let's spin up an Express server and create a route /status. Call the global function process.uptime() and send it as a json response. This route will provide uptime in seconds everytime you reload the page.
app.get('/status',(req,res)=>{
  var uptime = process.uptime() // Time in seconds
  res.send({uptime})
})
But, we want a mechanism that will check this automatically without having to reload the browser everytime.
We will implement exaclty that. Keep reading! But before, let's discuss each scenario
Application Crashed?
Developers usually use managers like pm2 or forever to manage the application and restarts it when fails. But it is genenrally not known unless logging is present, how many times the application has been restarted or why it has crashed in the first place?
Enable logging at various levels. I've used a very common package called Winston. Simply stream the log data to /status route.
const winston = require('winston')
const logger = winston.createLogger({
  level: 'info',
  format: winston.format.json(),
  defaultMeta: { service: 'user-service' },
  transports: [
    new winston.transports.File({ filename: 'error.log', level: 'error' }),
    new winston.transports.File({ filename: 'combined.log' }),
  ],
});
logger.add(new winston.transports.Console({
  format: winston.format.simple()
}));


app.get('/test-page', (req, res) => {
  logger.log({
    level: 'info',
    message: 'Called route /test-page'
  });
  res.render("test-home", {
    layout: 'test',
    isProduction
  })
})Server Crashed?
Server is down? The reasons could be many such as hosting maintenance, server update or DDOS etc. When this happens, we can't even go to the /status endpoint for monitoring. We need a third party for this.
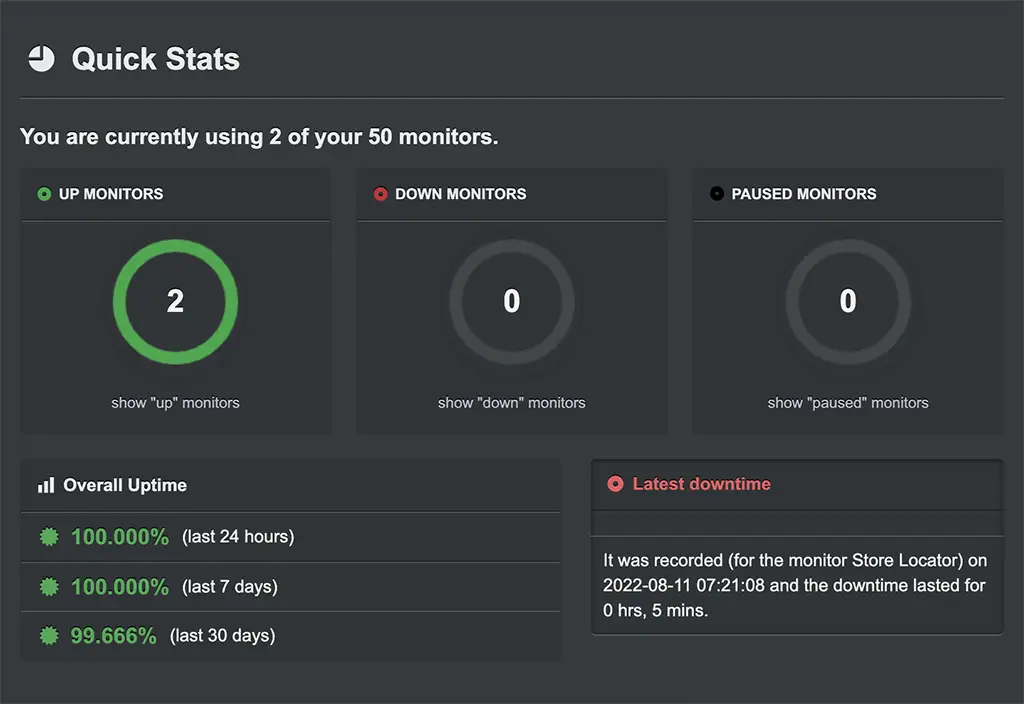
Third party services like Uptimerobot, Pingdom, Uptime etc help in monitoring the health of our application. Most of these provide free versions too.
If you dont want to go with a third party service, design your own on a different server using Socket IO & Express. Or Use Express Server Monitor
Dashboard snapshopt of uptimerobot
Monitor Heavy Computations
Typically node js is not suitable for heavy computations but sometimes there is no choice. At this point, we would want to identify the bottle necks and time the server is taking to do those computations.
let init = Date.now();
for (let i = 0; i < 9999999; i++)
{
    /* Large Computation */
    // var x = Math.random().toString(36).substring(2)
    // var x = 12+12
}
let end = Date.now()
console.log(`${(end-init)/1000}s`)
In the above examples, I've calulated the time taken for the math calculation. It is about 7 seconds and the latter (12+12) contributed to only 0.25 seconds. Save the results to logs, or database or even send an email if its over the threshold
Website Health Check
Till now, we discussed how to health check the backend application. But what about the frontend? The website? Sometimes, the application runs fine but still the website seems to be down because of expired SSL certificate, Invalid domain name or application crashed at runtime etc. How do we then monitor these things?
We can simply use the axios package to get the requests. Check if it encounters an error. Below code is pretty much self explanatory.
require('axios').get('<WEBSITE ADDRESS>')
  .then(function (response) {
    console.log(response.status);
  })
  .catch(function (error) {
    console.log(error.code);
    /* Error Codes
    CERT_HAS_EXPIRED
    ERR_TLS_CERT_ALTNAME_INVALID
    DEPTH_ZERO_SELF_SIGNED_CERT
    */
  })
Conclusion
Health checks are very beneficial at any level of programming. The complexity just varies on how it is implemented and what the end result is. AWS also implements health checks in EC2 which is coupled with cloudwatch alarms so that the user can get notified. In my next update, I will publish the code for monitoring for websites, ssls and more. Stay tuned for more updates on this!
Post a comment
Comments
Recent Posts

Webcam to CCTV
Do you want to access your webcamera remotely? Then this article is for you.

Calendar Picker
Calendar Picker / Appointment Setter JS CSS Library. Inspired by Calendly.

File Sharing Server
Create a local file sharing server with realtime sync feature using Socket IO.

Tailwind Navbars
Most beautiful Navbars designed with tailwind css. Fully responsive templates.
Dashboard UIs
Most beautiful dashboards designed with bootstrap 5. Inspired mostly from dribble and other sources.

HTML Email Tempaltes
Most commonly used HTML email templates. Welcome email, sign up, password reset etc.

Payment Page UI
Checkout our most downloaded payment page ui designed with bootstrap.

Auto Logout Feature
Detect user's inactivity and auto logout after certain timeout using various JS features.

HTML Popups
Keep the user engaged and gain recurring website traffic. Includes templates.

Geolocation
How to get a user's location using Javascript and other techniques available today.
